Real Time Power
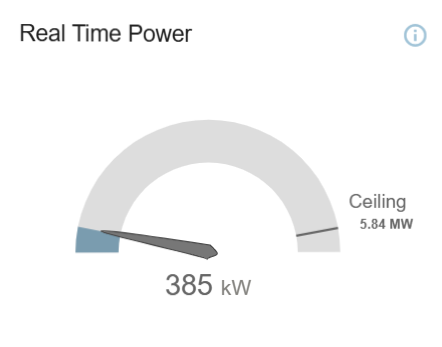
The Real Time Power data chart displays the total power that is currently flowing to the EVs from your charging stations. Spikes in power usage can get expensive. If your utility rate increases above a specific threshold, the total amount of power used to keep your costs down can be limited to ensure efficiency.
Figure 1: Real Time Power Data Chart