Station Usage
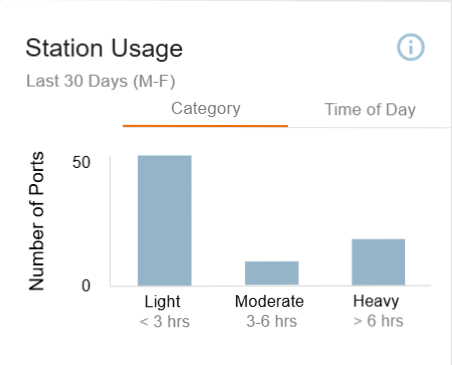
The Station Usage data chart displays the number of ports in usage from Monday to Friday over a span of 30 days.
The ports are classified into the following categories:
-
Light: Displays the number of ports that were in use for less than 3 hours.
-
Moderate: Displays the number of port that were in use for 3 to 6 hours.
-
Heavy: Displays the number of ports that were in use for more than 6 hours.
Time of Day: Displays port usage mapped to the time of the day.
Figure 1: Station Usage Data Chart